
Debugging Tools
A debugger is a tool which programmers can use to test code, and specifically to find errors in programs which may not be working as expected. This can be done without modifying the code. Values of variables can be examined, and the program can be run one step at a time, or interrupted at set points as necessary.
Each of the compilers on the cluster has an associated debugger utility, invoked by the commands as follows:
- GNU: gdb
- Intel: idb
- PGI: pgdbg
As might be expected, debugging code running on multiple CPUs and multiple hosts can be considerably more complex than in the single CPU case. It is possible to use the debugging tools above, but users of the Nottingham HPC also have access to Allinea's Distributed Debugging Tool (DDT).
This is a sophicated tool, and users will need to familiarise themselves with its features via on-line help, or the user manual. Some basic advice to get started on the Nottingham system is given below.
DDT is invoked with the command
ddtThis is best done in the same working directory from which you job is usually submitted to the queues. You should also ensure all relevant modules and/or environment variables are set before invoking ddt. The source code should be in a readily accessible directory, preferably alongside the directory from which you invoke ddt (perhaps having 'build' and 'run' subdirectories)
On the Nottingham system, jobs to be debugged should always be submitted to the queues via ddt, rather than trying to attach ddt to already running jobs. The latter method will fail.
It is assumed most users of ddt will be debugging programs using OpenMPI, and the default configuration has some settings specific to OpenMPI. DDT can be used to debug programs using other MPI implementations, as well as OpenMP, though these have not been tested.
If you change settings for DDT, these are stored in a file called
config.ddtin a directory
.ddtTo restore default settings, simply delete this file.
To run and debug a program, the application executable, and any parameters it needs will have to be input to the 'DDT - Run' dialog, pictured below.
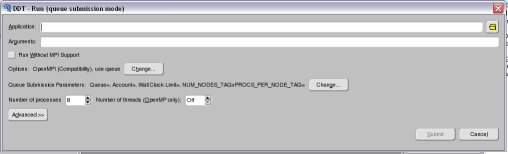
DDT cannot use the ompisub/mpisub wrapper scripts for submission to queues, so an appropriate 'qsub' command also has to be specified. This can be done from a dialog opened by clicking the 'Change...' button on the 'Options' line of the DDT-Run dialog, and selecting 'Job Submission' from the left of the new window. The default configuration specifies this as
qsub -V -cwd -l h_rt=43000The relevant parallel environment options need adding to this, and it is recommended that a job name is also specified using the '-N' option, for example
qsub -V -cwd -l_h_rt=43000 -pe openmpi 2 -N myapp2nodesuses the openmpi parallel environment, specifying that 2 nodes are required, and names the job 'myapp2nodes'. The 'h_rt' resources option is useful for getting the job run on short queues, which are likely to be more readily available. If the time limit is specified as 3600 or less, then the very short queues are also available. However, if your program run exceeds the time limits specifies it will be terminated.
The other options which need specifying to run a job through DDT are the total number of processes, and the 'shared directory'. On towerE, the total number of processes would normally be 8 x number of nodes, as each node has 8 processing cores. It is possible to specify less, but 8 processes per node should be the maximum. The 'shared directory' needs to be a directory accessible to all compute nodes, and writable by the user. A directory under the /work area, e.g.
/work/work5/egxcbmight be a suitable choice for user egxcb.
Please let us know if you are using DDT, and whether is has been useful. We will try and assist with any problems you have, and will consult with the suppliers (Allinea) when necessary.
Note: The number of processes supported by our DDT licence is 64, shared across the HPC system. This means one user could debug a 64 process application, but there would be no licences left for anyone else. Alternatively, 2 users could each debug 32 process applications, and so on.
To check availability of licences, go to the licence monitoring web-page.