Measuring growth
Growth is measured and plotted on centile charts developed and distributed by the Royal College of Paediatrics and Child Health (RCPCH). These charts are U.K. based and represent how U.K. children grow from birth to adulthood. Whilst a baby’s weight, height and head circumference are measured and charted from birth, periodic measurements continue to chart how the child then grows.
The centile lines on the chart show how children of different weight and height grow during childhood. Usually, a child grows along 1 of the lines or between 2 of the lines on the chart. It’s possible for the child to move across lines, particularly in the first couple of years of life given changes in nutrition and other environmental influences, but it is more usual though for a child to grow along one.
By 5 years of age, a child will have grown to around a 3rd of their expected adult height.
Be aware
When a child crosses a centile line, particularly if weight gain is static then this could be cause for concern and may require investigating. This could be associated with an underlying condition that leads to an inability to digest food or it may just be that the child is refusing to eat foods they do not like, such as a child who eats well at home, but has decided they don’t like the foods offered at nursery. It may also be more serious and an indicator of neglect.
Growing unusually: A child who is increasing in height in this way is not following a usual pattern. It may reflect a period where growth was slower for a specific reason though, so may reflect the child catching up.
Looking: Babies make eye contact with parents and carers as a signal for a social response which they find rewarding. If there is no response then the baby is disturbed. This has implications - for example if a parent has depression or is too preoccupied to respond to the baby, the baby will become distressed and may eventually give up trying to make eye contact.
Normal: Normally a child grows along one of the lines or between two lines on the chart.
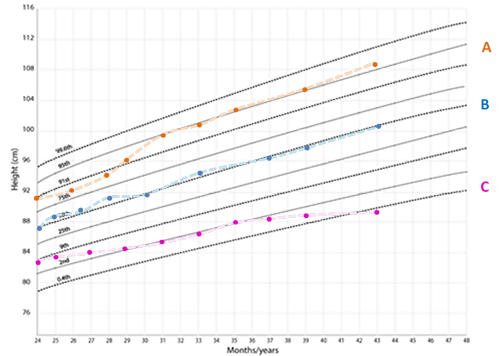
Early years growth chart. Adapted from: Royal College of Paediatrics and Child Health (2009).
A: A child who is increasing in in height in this way is growing unusually. It may reflect a period whereby growth was slower for a specific reason though so may reflect the child catching up.
B: Usually a child grows along a line or between 2 lines on the chart
C: Growth is very slow and has fallen through several lines. This would be a cause for concern.