Project title: Investigation into the sources of uncertainty in the optical measurement of gears
Start: October 2021
Student: Denis Sexton
Supervisors: Richard Leach, Sofia Catalucci
Funding: MTC
This PhD project focuses on the investigation of calibration methods applied to optical and tactile co-ordinate measurements. The project targets the evaluation of the sources of uncertainty in measurement and, more specifically, how sensitivity coefficients are currently identified, calculated, and applied. Based on past knowledge and current research activities following established uncertainty guidelines [1], the aim of this research is to identify a list of all possible uncertainty contributions and investigate them using designed experimental theory. This could identify the mathematical cause and the effect relationship between sensitivity coefficients, whilst finding any interactions between them. The use of established statistical metrics should indicate which inputs and interactions had the major influence on the measurement and their quantification. In addition, the proposed method may lead to the definition of a more effective and perhaps simpler uncertainty model.
The project will focus on the analysis of real data in time series obtained from the measurement of selected test artefacts. Master gears are considered the most appropriate measurand for the purposes of this project, and the analysis of their measurements obtained by optical and tactile means will lead to meaningful results for this correlation work. The Evaluating of the Measurement Process (EMP) method [2] of gauge study is planned. Currently, there is no pre-defined number of repeated measurements required to obtain optimal results, although some standards define minimum sets of measurements. More importantly, there is no requirement to investigate the type of variation from the repeated measurements. If any “special cause” variation appears during repeated measurements, some assumptions could be invalidated. An analysis of measurement repeatability using time series control charts (such as ANOME, ANOM and ANOR) are suitable for this part of the project. Sample charts are shown in figures 1 and 2 below.
|
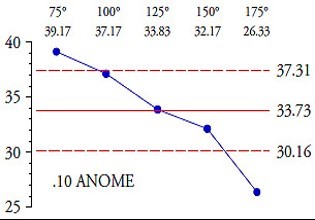
Figure 1. ANOME Combined Means Analysis (10%)
|
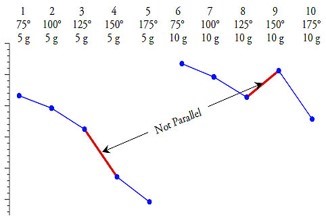
Figure 2. ANOM Graphical Analysis of Interaction
|